Data Interpretation Practice Questions: Level 01

DIRECTIONS for questions 1 to 3: The following table gives the data about big 12 software exporters in India from 1997-98 to 1999-2000 (Revenue in Rs. crore).
Suggested Action:
FREE Live Master Classes by our Star Faculty with 20+ years of experience.
Register Now
    1997 – 98 1998 – 99 1999 – 2000
1. Tata Consultancy Services 955.27 1518.50 1820.35
2. Wipro 388.94 632.50 1037.30
3. HCL Technologies 446.53 862.14 908.00
4. Infosys 250.93 500.25 869.70
5. Satyam 178.11 376.62 662.93
6. NIIT 258.38 394.96 551.79
7. Silverline Technologies 45.32 103.95 434.83
8. Cognizant 113.16 290.03 414.26
9. Pentamedia - 389.02 -
10. Pentasoft - - 353.01
11. Patni Computers 137.58 219.90 295.51
12. IBM Global 115.32 227.63 271.14
  1. What is the lowest rate of growth of 1998-99 to 1999-2000 for any of the companies given in the chart?
    A. 0%
    B. 12.7%
    C. 19.1%
    D. 10.1%
    E. 5.3%

  2. Which of the following statement is true about the share of exports of Tata Consultancy Services in the total exports of the 12 companies?
    A. It has almost doubled in 1999 – 00 over 1997 – 98.
    B. It has been steadily increasing
    C. It is more or less constant.
    D. It has dropped by about 10 %.
    E. None of these.
  3. If total software exports in 2000 – 2001 were expected to be Rs 10,000 crore and the growth of Infosys is the same as it was in 1999 – 2000, what would have been Infosys’ share of exports of these 12 companies in 2000 – 2001?
    A. 15%
    B. 19%
    C. 21%
    D. 23%
    E. None of these
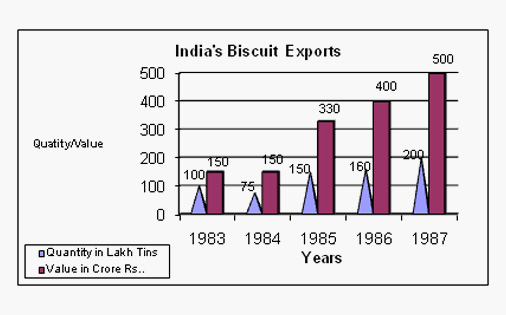
DIRECTIONSfor questions 4 & 5: Study the following graph and answer the questions that follow.
Data Interpretation Practice Questions
  1. In which year was the value per tin the minimum?
    A. 1987
    B. 1984
    C. 1985
    D. 1986
    E. 1983
  2. If in 1986 tins were exported at the same rate per tin as in 1985, then what would be the value of exports in 1986? (Crores of Rupees)
    A. 400
    B. 420
    C. 375
    D. 330
    E. 352
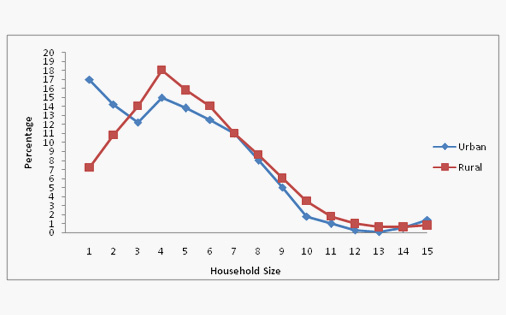
DIRECTIONS for questions 6 to 10: The percentage distribution of households by household size and the average sizes of household in.
  • All India Rural and Urban areas.
  • Urban areas classified as per population size are presented below.
Data Interpretation Practice Questions
All India Distribution of People Average Size of Household
Rural - 5.08
Urban - 4.60
Distribution of Urban Below 15, 000 4.75
15, 000 - 50, 000 4.50
50001 – Above 4.70
  1. In rural areas, which one of the following sizes of the households is the highest in number?
    A. 15
    B. 2
    C. 3
    D. 4
    E. Can't be determined
  2. In urban areas, among the households of different sizes, what is the percentage of households of size 5 or less?
    A. 13
    B. 72
    C. 36
    D. 87
    E. Can't be determined
  3. In rural areas, per 100 households, there were 31 households of size:
    A. 3 or above
    B. 3, 4 and 5
    C. 3 or less
    D. 4 or less
    E. 5 or more
    Suggested Action:
    Kick start Your Preparations with FREE access to 25+ Mocks, 75+ Videos & 100+ Chapterwise Tests.
    Sign Up Now
  4. As the urban population of towns increase, the average household size
    A. Increases
    B. Decreases
    C. remains constant
    D. Fluctuating
    E. Decreases with the exception of category 50,000 and above
  5. Which one of the following statements is true?
    A.On the average there are more persons per family in urban areas than in rural areas.
    B.In rural areas, 35 per cent of the households are of the size 7 and above.
    C.In urban areas, the average size of the household is the least for towns.
    D.In urban areas, there are 460 persons on an average per 100 households.
    E.None of these
Rate Us
Views:330660