A Bar Graph is an outline that uses vertical or horizontal bars to demonstrate comparison between various categories of information. There are two axis, one is horizontal i.e X axis & other one is vertical i.e Y axis. X-Axis represents the categories being compared & Y-Axis describes the values of data for the respective category. Bar graphs can be represented in the form of either horizontal bars or vertical bars.
Bar chart is one of the easiest, most attractive and commonly used methods for presenting data in graphs. Questions based on these charts are commonly asked in competitive exams. Further, in these Charts, the questions based on percent change and weighted averages are generally asked in exams.
Different types of bar charts & How to make a Bar Graph
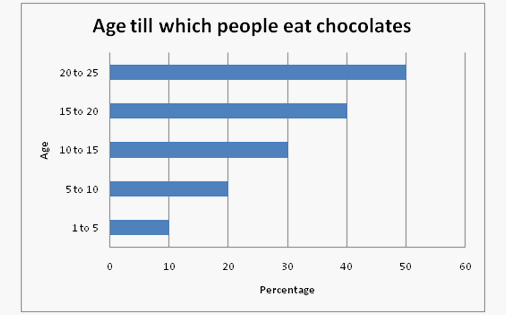
Horizontal Graphs
Bar Graphs are generally drawn with vertical bars which suggests that the taller the bar, the bigger the Value. Therefore, it is Possible to make various horizontal bar outlines which implies that if the Bar is longer then, the information is larger.
This turns out to be especially powerful when the distinctive categories have long titles that would be hard to mention below a typical vertical bar, or when there are a higher number of various objects and there is inadequate area to contain all the various columns necessary for a vertical diagram in a page.
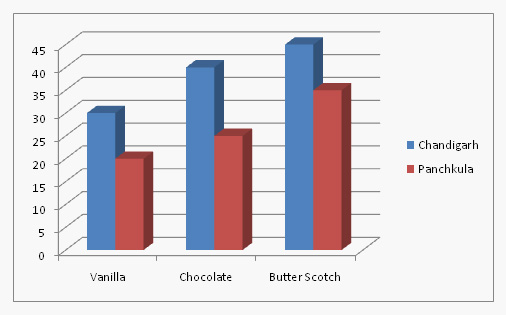
This diagram indicates data about various sub-groups of the primary objects. In the diagram given beneath, a grouped bar graph has been used to demonstrate the diverse sub-groups of materials. These graphs are used to demonstrate a few sub-groups of every object but it should be taken care that the graphs does not contain excessive data. These graphs can be drawn horizontally or vertically which depends on the various values of information given in the question.
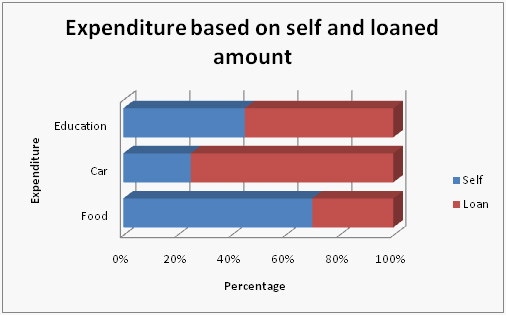
These bar charts comprise of some bars which are sequentially placed on top of each other to represent a single graph. The total length of the bar will give information of the total amount of category ,whereas different colors or size will be used to give information on the relative amount of the sub-categories given in the question .Such graphs are frequently asked in the exam and that is why they are very important as per exam point of view.

 (1)_2.jpg?null)


 (1)_12.jpg?null)


