
 (1)_2.jpg?null)
| 1997 – 98 | 1998 – 99 | 1999 – 2000 | ||
| 1. | Tata Consultancy Services | 955.27 | 1518.50 | 1820.35 |
| 2. | Wipro | 388.94 | 632.50 | 1037.30 |
| 3. | HCL Technologies | 446.53 | 862.14 | 908.00 |
| 4. | Infosys | 250.93 | 500.25 | 869.70 |
| 5. | Satyam | 178.11 | 376.62 | 662.93 |
| 6. | NIIT | 258.38 | 394.96 | 551.79 |
| 7. | Silverline Technologies | 45.32 | 103.95 | 434.83 |
| 8. | Cognizant | 113.16 | 290.03 | 414.26 |
| 9. | Pentamedia | - | 389.02 | - |
| 10. | Pentasoft | - | - | 353.01 |
| 11. | Patni Computers | 137.58 | 219.90 | 295.51 |
| 12. | IBM Global | 115.32 | 227.63 | 271.14 |
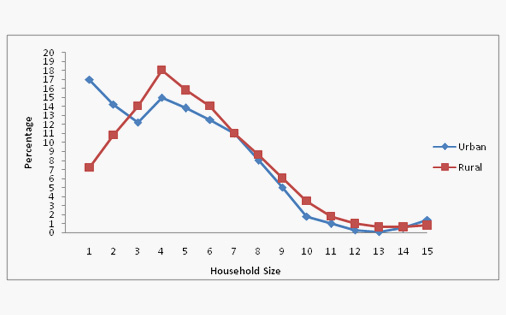
| All India | Distribution of People | Average Size of Household |
| Rural | - | 5.08 |
| Urban | - | 4.60 |
| Distribution of Urban | Below 15, 000 | 4.75 |
| 15, 000 - 50, 000 | 4.50 | |
| 50001 – Above | 4.70 |


