Data Interpretation Practice Questions : Level 03

DIRECTIONS for data interpretation questions 1 to 5: Study the graph and table below and answer the questions.
Chart 1 gives the year on year growth in % of various sectors in 1996-97. Chart 2 gives the weight of each of these sectors in the overall industrial output of the country for the 1995-96. Wherever the weights in the year 1996-97 are needed, if nothing is specified, take it same for the year 1996-97 also
Suggested Action:
FREE Live Master Classes by our Star Faculty with 20+ years of experience.Register Now
  1. What was the % YOY growth in industrial output, between the two years?
    1. 9.52%
    2. 4.5%
    3. 6.3%
    4. Cannot be determined
    Sol: Option 1
    Explanation:Percentage YOY growth in industrial output
    = (15 x 0.22) + (10 x 0.06) + (9 x 0.07) + (13 x 0.22) + (2 x 0.17) + (4 x 0.04) + (13 x 0.10) + (3 x 0.11) = 9.52 %
  2. If in 1997-98, Paper were to account for 12% weight in the overall industrial output, at what rate should it grow assuming that the other sectors grow at 10 % each?
    1. 20%
    2. 120%
    3. 225%
    4. None of these
    Sol: Option 2
    Explanation: The best answer is 2.
    Current weight of paper is 6%.
    Assuming total output as 100, paper accounts for 6 units.
    In 97-98 total output would be 110 if paper has to account for 12% then it has to be 110 x 0.12
    = 13.2 units so growth rate is to be
    7.2/6 = 120%.
  3. If the overall industrial output in 1997-98 were to grow by 10 % and the growth of the chemical sector during this period was 26 %, what % weight would it have in the industrial output in 1997-98?
    1. 25.2%
    2. 18.7%
    3. 28.8%
    4. 31.4%
    Sol: Option 1
    Explanation: The best answer is 1.
    New weight would be 22 x 1.26/1.1
    = 25.2%
  4. If the cotton textile sector continued to grow at the same rate, in how many more years will its output double?
    1. 4 yr. 3 months
    2. 4 yr. 11 months
    3. 5yr. 3 months
    4. 5yr. 9 months
    Sol: Option 1
    Explanation: The best answer is 1.
    Current growth rate of cotton sector = 15%.
    Applying the CI basic, the total time becomes roughly 5 yrs and 3 months.
    The questions is how many more years, hence option 1st is the answer.
  5. Which one of the following cannot be inferred?
    1. The top three sectors accounted for more than 60% weight in the overall industrial production of the country.
    2. The smallest three sectors accounted for less than 20% weight in the overall industrial production of the country.
    3. Metals accounted for over a fifth of the overall industrial production of the country.
    4. Mining, necessarily, could not have accounted for more than a fifth of the industrial production of the country.
    Sol: Option 4
    Explanation: The best answer is 4.
    1. Top 3 sectors accounted for 23 + 22 + 17 = 60%
    2. Each of the smallest 3 sectors = 4, 6, and 7% of the weight
    3. Metals accounted for 18% which is slightly more than 1/6 of output(very close to 1/5)
    4. Nothing is mentioned about mining
DIRECTIONS for questions 6 & 10: Refer to the information given below and answer the questions that follow:
Given the total capacity of the five companies given is 751000 tons(Percentage breakup is of capacity)
Production and the total in 1994-95
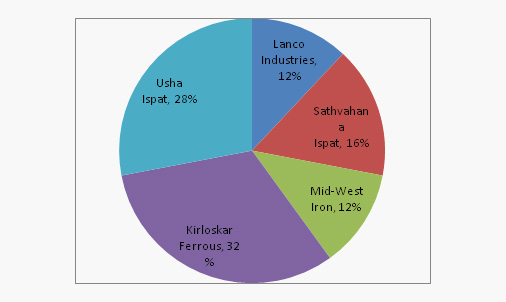
Name Production (in tonnes) Capital cost(Rs. million)
Lanco Industries 31,994 540.00
Sathvahana Ispat 80,759 544.92
Mid-West Iron 63,214 399.96
Kirloskar Ferrous 103,484 999.84
Usha Ispat 194,176 844.00
  1. Which company had the highest capacity utilisation?
    1. Sathavahana ispat
    2. Mid-west Iron
    3. Usha Ispat
    4. Kirloskar Ferrous
    Sol: Option 3
    Explanation: Capacity utilisation: By observation it has to be Mid west iron or Usha Ispat. Mid west iron ≥ 63214/90000 x 100 = 70% nearly. Usha Ispat 194176 / 211 x 100 = 92% nearly. Hence Usha Ispat is the answer, thus 3rd option.
  2. Which company had the lowest capital cost per tonne of capacity?
    1. Sathavahana Ispat
    2. Mid-west Iron
    3. Kirloskar Ferrous
    4. Usha Ispat
    Sol: Option 4
    Explanation: Capital cost per tonne of capacity
    Lanco = 540 x 106 / 90 x 103 = Rs. 6,000.
    Sathavahana = 544.92 x 10⁶ / 120 x 103 = Rs. 4,374. Mid-west Iron = 399.96 x 10⁶ / 90 x 103 = Rs. 4,449. Kirloskar Ferrous = 999.84 x 10⁶ / 240 x 103
    = Rs. 4, 166.
    Usha Ispat = 884 x 106 / 211 x 103 = Rs. 4,000.
    Hence Usha Ispat, 4th option.
  3. If the given capacity of the five companies account for 87% of the total capacity in the country, what is the total capacity in the country?
    1. 800 m tonnes
    2. 900 m tonnes
    3. 863 m tonnes
    4. 1000 tonnes
    Sol: Option 3
    Explanation: Total capacity of the five companies = 751000 tonnes which is 87 % of the country's production
    Hence total capacity = 751000/0.87
    = 863,000 tonnes nearly
  4. What is the capacity utilisation of the company, which has the highest capacity?
    1. 70%
    2. 66%
    3. 43%
    4. 91%
    Sol: Option 3
    Explanation: Highest Capacity is of Kirloskar Ferrous = 240 x 103
    Its capacity utilisation = (103484/ 240 x 103) x 100 = 43%
  5. Suggested Action:
    Kick start Your Preparations with FREE access to 25+ Mocks, 75+ Videos & 100+ Chapterwise Tests.Sign Up Now
  6. What is the aggregate capacity utilisation of the five companies in 1994-95?
    1. 70%
    2. 75%
    3. 63%
    4. 50%
    Sol: Option 3
    Explanation: Total capacity = 751000 tonnes total production
    = 31, 994 + 80, 759 + 63, 214 + 103, 484 + 194,176
    = 473, 627
    Utilisation = 473, 267/751000 = 63%
Views:65235