A factory employs three machines M1, M2 and M3 to manufacture three products X, Y and Z. Each machine runs for 12 hours a day. The following table gives the time taken (in minutes) by each machine to manufacture 1 unit of each of the products.
M1
M2
M3
X
12
15
16
Y
18
9
15
Z
10
18
12
Ex.1 What is the maximum number of products that can be manufactured in a day?
1. 125
2. 155
3. 200
4. 212
Sol: Since the maximum number is asked, the machine time of the product being manufactured must be minimum. On machines M1, M2 and M3, products X , Y and Z need minimum time respectively.
Since each machine has 720 minutes of manufacturing time, 72 units of Z, 80 units of Y and 60 units of X can be manufactured on the three machines respectively. Thus, the maximum units that can be manufactured in a day is 212.
Ex.2 On a particular day, the demand for 40 units of X and 50 units of Y must be met. If the remaining production is of product Z only, what is the maximum number of units of Z that can be manufactured on that day?
1. 81
2. 85
3. 99
4. None of these
Sol: Let X and Y be manufactured on machines where they need minimum manufacturing time.
So, X and Y are manufactured on machines M1 and M2 respectively. Manufacturing 40 units of X on M1 leaves 720 – 480 = 240 minutes of manufacturing time.
So, 24 units of Z can be manufactured on this machine. Manufacturing 50 units of Y on M2 leaves 720 – 450
= 270 minutes of manufacturing time.
So, 15 units of Z can be manufactured on this machine. Since M3 has 720 minutes of manufacturing time, 60 units of Z can be manufactured on this machine. So, the total units of Z that can be manufactured is 99
Ex.3 A unit of Y can be manufactured only after 3 units of X and 4 units of Z have been manufactured. What is the minimum time required to manufacture 15 units of Y?
1. 1359 minutes
2. 1442 minutes
3. 1556 minutes
4. 1655 minutes
Explanation: Before manufacturing 15 units of Y, 45 units of X and 60 units of Z must be manufactured. X-M1 → 540 minutes, Z-M1(18 units) → 180 minutes, Z-M3(42 units) → 504 minutes , Y-M2(15 units) → 135 minutes. So, the total is 1359 minutes
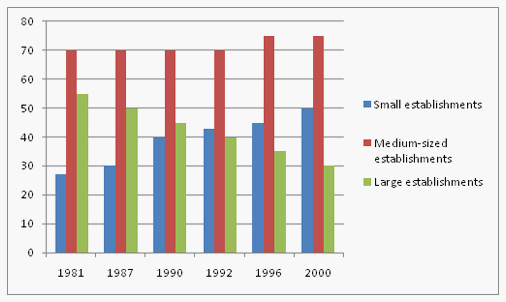
Directions for questions 4 to 8: The following diagram shows the percentage share of manufacturing sector in total employment in small, medium and large establishments individually. The definitions of small, large and medium establishments are shown below in the diagram
Note: Small establishments are defined as those with fewer than 100 employees. Medium-sized establishments are defined as those with between 100 and 1500 employees. Large establishments are defined as those with more than 1500 employees. Study the diagram carefully and answer the questions given below:
Ex.4 In 1981 and 1987 about 50 million and 60 million people were employed in small establishments. What was the difference between the no. of employees employed in manufacturing sector small establishments in 1981 and 1987?
1. 4.6 million
2. 13.5 million
3. 5 million
4. 6.3 million
Sol: Data interpretation formulas:
Reqd Number of employees in 1981 = 50 x 27/100 = 13.5,
Reqd Number of employees in 1987 = 60x30/100 =18.
Required difference = 18 - 13.5 = 4.5
Ex.5 In 1981 about 30 million employees were there in the large establishment. Then how many employees were there in the medium-sized establishments? (Approximately)
1. 25 m
2. 40 m
3. 35 m
4. Can't be determined
Sol: No relationship is defined between large establishments and medium-sized establishments, thus cannot be determined.
Ex.6 In 1987, about 40 million employees were there in the large establishments. The population of employees from 1987 to 2000 grew by 60% in large establishments. How many employees were there in the manufacturing sector in large establishments in 2000?
1. 33.2 m
2. 69.3 m
3. 19.2 m
4. 47.2 m
Sol: 40 x 1.6 = 64m.
In 2000, there were 64 m x 30/100 = 19.2 m
Ex.7 Suppose that in 1996, there were 100,000 employees in manufacturing sector. There were 750 small establishments. What was the average number of employed persons per small establishment manufacturing unit?
1. 36
2. 41
3. 56
4. Can't be determined
Sol:Option 4
Cannot be determined as total manufacturing employees are given and what is required is the no. of employees in small establishment manufacturing units.
Out of the manufacturing, how many belong to the small manufacturing establishments.
Ex.8 Which of the following is/are correct?
I. Share of manufacturing employment in small establishment is rising steadily.
II. In large establishments there is growing unemployment.
1. I only
2. II only
3. I and II
4. Neither I nor II
Sol: Only I.
The data given is related to the manufacturing large establishments and not large establishments in general
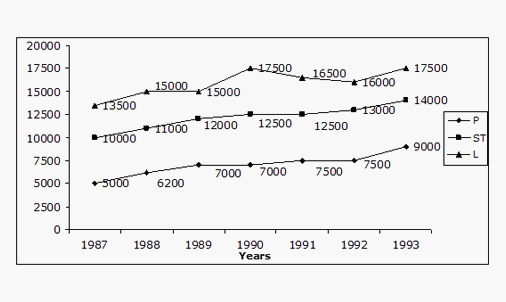
Directions for questions 9 to 11: Refer to the graph given below and answer the questions given after that accordingly.
The graph given shows price variation of three types of wood over 1987 – 1993 in Rs/m3. 1 ton = 1000 kg and 1m3 = 800 kg.
Ex.9 Maximum increase in price/ m3 for any product for any two consecutive years was in which of the products?
1. P
2. ST
3. L
4. None of these
Sol: It can be seen that it is maximum in case of L in the consecutive years from 1989 to 1990. Be careful, the question is not talking of the percentage increase but of maximum increase.
Ex.10 In 1993, a company's total sales was made of 40% of P, 30% of ST and 30% of L. The average realization per m3 in 1993 was:
1. Rs. 8121
2. Rs. 7211
3. Rs. 6567
4. None of these
Sol: Find 40% of P in the year 1993 i.e. 9000 x 40/100 = 3600.
Now find 30% of ST 14000 x 30/100 = 4200.
And find 30% of L i.e. 17500 x 30/100 = 5250.
The total is more than 10000, which is not given in any of the options; hence the answer is none of these.
Ex.11 Which of the following has shown maximum %age change in its value over any two consecutive years?
1. ST
2. P
3. L
4. None of these
Sol: By approximation it can be seen in the year 1988 there is approx.
25% increase from the previous year in the P.
Hence 2nd option is the answer.
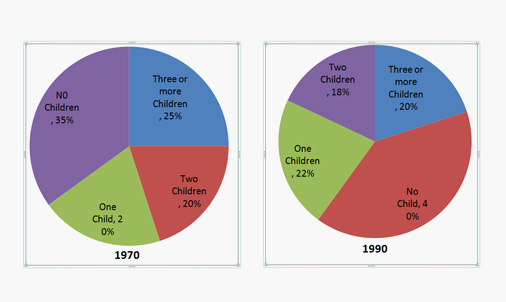
Directions for questions 12 to 13: The table given below provides the number of households in a country during the period 1970 to 1990. The pie-chart gives the distribution of households based on the number of children for the years 1970 and 1990.
Year
No. of households (millions)
1970
120
1972
123
1974
126
1976
129
1978
132
1980
135
1982
140
1984
145
1986
150
1988
155
1990
160
Ex.12 How many households were without any children in 1990 if it is given that the average number of children per household in 1990 was 3?
1. 24 million
2. 64 million
3. 14 million
4. Cannot be determined
Sol: No. of household in 1990 = 160 million.
Household without any children in 1990 = 40%, therefore household without any children
= (40/100) x 160 = 64 million. Hence the answer is Option (2).
Ex.13 According to the above pie graphs, In 1970 the average number of children per household in 1970 was
1. 1.18
2. 1.35
3. 2.0
4. Cannot be determined
Sol: As there is a category, which gives the no. of children to be 3 or more than three, hence the average number of children per household cannot be calculated, thus Option (4).

 (1)_2.jpg?null)


 (1)_12.jpg?null)


