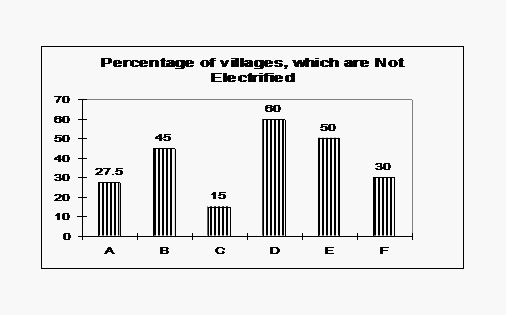
If the Central Govt. desires to give funds for speedy electrification, which state will get 3rd rank in the order of priority?
A. C
B. B
C. A
D. None of these
Answer: B
The ranking as per percentage of villages which are not electrified is
Rank I
Rank II
Rank III
D
E
B
It is obvious that to give aid for speedy electrification, state 'B' will get 3rd rank.
Which state has three times the percentage of non- electrified villages in comparison to 'C' state?
A. C
B. F
C. B
D. None of these
Answer: C
Clearly, from the graph,% of non electrified villages of 'C' = 15%.
% of non electrified villages of 'B' = 45% which is three times of C's %. Hence answer is option C.
In case of State B, what percent of villages are electrified?
A. 75%
B. 15%
C. 45%
D. None of these
Answer: D
In case of State B, 45 % of villages are not electrified.
% of electrified villages = (100 – 45) = 55%.
How many states have atmost 40% or less non electrified villages?
A. 5
B. 3
C. 4
D. 6
Answer: B
For States F, A, C (i.e. 3 states), we have 40% or less non electrified villages.
Which state has the minimum % of Non electrified villages?
A. A
B. B
C. C
D. D
Answer: C
Clearly from the graph, For State 'C' non electrified % is minimum.
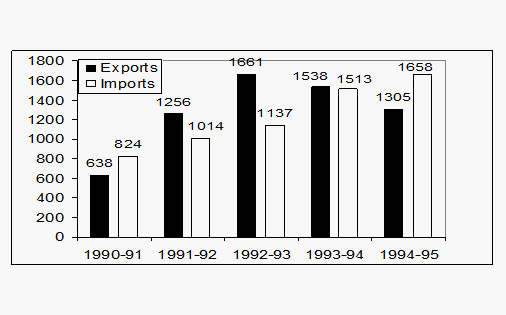
DIRECTIONS for questions 6 to 10: Study the following graph carefully and answer the questions given below:
What is the ratio of exports in years 1990-91 & 1992-93 together to the imports in the same year?
A. 1.41
B. 1.17
C. 1.55
D. 1.71
Answer: B
Sum of exports of 1990-91 and 1992-93 = 638 + 1661 = 2299
Sum of exports of 1990-91 and 1992-93 = 824 + 1137 = 1961
The required ratio = 2299 / 1961 = 1.17
In which of the following years was the gap in the exports and imports the maximum?
A. 1994-95
B. 1992-93
C. 1993-94
D. 1990-91
Answer: B
Difference for 1994-1995 = 1658-1305 = 353
Difference for 1992-1993 = 1661-1137 = 524
Difference for 1993-1994 = 1538-1513 = 25
Difference for 1990-1991 = 824-638 = 186
In this case we can observe that 1992-1993, the gap in the exports and imports is maximum. Hence, answer is option B
What is the ratio of years having above average imports to those having below average imports in the given period?
A. 3:2
B. 4:1
C. 2:3
D. 1:4
Answer: C
The average imports = (824+1014+1137+1513+1658)/5 = 1229.2
The years 1990-91, 1991-92, and 1992-93 have below the average imports.
The years 1993-94 and 1994-95 have above the average imports.
Required Ratio = 2:3
If the Central Govt. desires to give funds for speedy electrification, which state will get 3rd rank in the order of priority?
A. C
B. B
C. A
D. None of these
Answer: B
The ranking as per percentage of villages which are not electrified is
Rank I
Rank II
Rank III
D
E
B
It is obvious that to give aid for speedy electrification, state 'B' will get 3rd rank.
Which state has three times the percentage of non- electrified villages in comparison to 'C' state?
A. C
B. F
C. B
D. None of these
Answer: C
Clearly, from the graph,% of non electrified villages of 'C' = 15%.
% of non electrified villages of 'B' = 45% which is three times of C's %. Hence answer is option C.
In case of State B, what percent of villages are electrified?
A. 75%
B. 15%
C. 45%
D. None of these
Answer: D
In case of State B, 45 % of villages are not electrified.
% of electrified villages = (100 – 45) = 55%.
How many states have atmost 40% or less non electrified villages?
A. 5
B. 3
C. 4
D. 6
Answer: B
For States F, A, C (i.e. 3 states), we have 40% or less non electrified villages.
Which state has the minimum % of Non electrified villages?
A. A
B. B
C. C
D. D
Answer: C
Clearly from the graph, For State 'C' non electrified % is minimum.
DIRECTIONS for questions 6 to 10: Study the following graph carefully and answer the questions given below:
What is the ratio of exports in years 1990-91 & 1992-93 together to the imports in the same year?
A. 1.41
B. 1.17
C. 1.55
D. 1.71
Answer: B
Sum of exports of 1990-91 and 1992-93 = 638 + 1661 = 2299
Sum of exports of 1990-91 and 1992-93 = 824 + 1137 = 1961
The required ratio = 2299 / 1961 = 1.17
In which of the following years was the gap in the exports and imports the maximum?
A. 1994-95
B. 1992-93
C. 1993-94
D. 1990-91
Answer: B
Difference for 1994-1995 = 1658-1305 = 353
Difference for 1992-1993 = 1661-1137 = 524
Difference for 1993-1994 = 1538-1513 = 25
Difference for 1990-1991 = 824-638 = 186
In this case we can observe that 1992-1993, the gap in the exports and imports is maximum. Hence, answer is option B
What is the ratio of years having above average imports to those having below average imports in the given period?
A. 3:2
B. 4:1
C. 2:3
D. 1:4
Answer: C
The average imports = (824+1014+1137+1513+1658)/5 = 1229.2
The years 1990-91, 1991-92, and 1992-93 have below the average imports.
The years 1993-94 and 1994-95 have above the average imports.
Required Ratio = 2:3

 (1)_2.jpg?null)