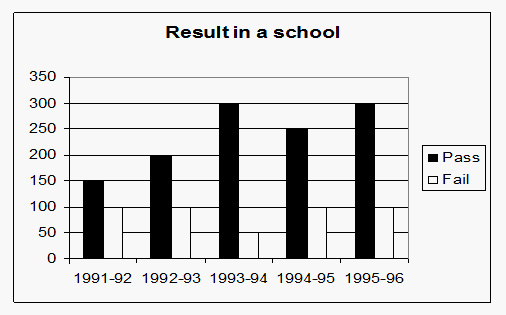
Directionsfor questions 1 - 5: Study the following graph carefully and answer the questions that follow. The graph shows the results of students in a school.
The difference of number of students passed to those failed is minimum in which year?
A. 1991-92
B. 1992-93
C. 1993-94
D. 1994-95
Answer: A
The difference between the number of students passed to failed for 1991- 92 = 150-100 = 50
The difference between the number of students passed to failed for 1992- 93 = 200-100 = 100
The difference between the number of students passed to failed for 1993- 94 = 300-50 = 250
The difference between the number of students passed to failed for 1994- 95 = 250-100 = 150
The difference is minimum for 1991-92,So, answer is A option.
How many times number of failed students is same?
A. 1
B. 2
C. 3
D. 4
Answer: D
By visual observation number of failed students is same in 1991-92, 1992-93, 1994-95,and 1995-96. Therefore, answer is four times.
What is an approximate percentage of students failed during 5 years?
A. 65%
B. 27%
C. 51%
D. 80%
Answer: B
For 1991-92 Passed = 150, Failed = 100
For 1992-93 Passed = 200, Failed = 100
For 1993-94 Passed = 300, Failed = 50
For 1994-95 Passed = 250, Failed = 100
for 1995-96 Passed = 300, Failed = 100
Required % = Total number of passed students / Total number of failed students = (100 + 100 + 50 + 100 + 100) / (250 + 300 + 350 + 350 + 400)
= 450 / 1650
= 27.27% ≅ 27%
When is the percentage increase in the total number of students maximum in comparison to the previous year?
A. 1995-96
B. 1994-95
C. 1993-94
D. 1992-93
Answer: D
In the year 1992-93, % increase = 100 x (300 - 250) / 250 = 20%
In the year 1993-94, % increase = 100 x (350 - 300) / 300 = (50 / 3)% = 16.6%
In the year 1994-95, % increase = 100 x (350 - 350) / 350 = 0%
In the year 1995-96, % increase = 100 x (400 - 350) / 350 = 14.2%.
Therefore, 20% is highest. Hence option A.
What is an average number of students failed in the school in last 5 years?
A. 190
B. 180
C. 80
D. 90
Answer: D
Total number of failed students = 100 + 100 + 50 + 100 + 100 = 450
Therefore, the required average = 450/5 = 90
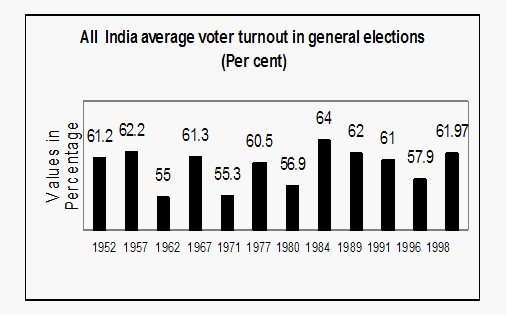
Directions for questions 6 – 10:Study the following graph and answer the questions given below:
The highest and lowest ever voters turn- out (in percentage)is respectively in which years?
A. 1984 and 1962
B. 1971 and 1977
C. 1957 and 1962
D. 1984 and 1971
Answer: A
By visual observation, In 1984, voters turn- out (in percentage)is highest which is 64%
In 1962, voters turn- out (in percentage)is lowest which is 55%.
In which of the options, the numeric difference in voters turnout (in percentage) was nearly equal to 7%?
A. 1957-62
B. 1984-89
C. 1996-98
D. 1971-77
Answer: A
Option (A) The required fluctuation = 62.2 – 55 = 7.2%
Option (B) The required fluctuation = 64 – 62 = 2%
Option (C) The required fluctuation = 61.97 – 57.9 = 4.07%
Option (D) The required fluctuation = 60.5 – 55.3 = 5.2%, Obviously Option (A) satisfies
The average voter turnout (in percentage) between 1952 to 1998 was approximately?
In which year was the growth in the average voter turnout (in percentage) to be the second highest in comparison to the previous elections?
A. 1967
B. 1984
C. 1998
D. 1977
Answer: A
For 1967, growth from 55 to 61.3 is 6.3%.For 1984, growth from 56.9 to 64 is 7.1%.
For 1998, growth from 57.9 to 61.97 is 4.07%. For 1977, growth from 55.3 to 60.5 is 5.2%
Therefore, for 1967 the average voter turn out to be the second highest in comparison to the previous elections.
Directionsfor questions 1 - 5: Study the following graph carefully and answer the questions that follow. The graph shows the results of students in a school.
The difference of number of students passed to those failed is minimum in which year?
A. 1991-92
B. 1992-93
C. 1993-94
D. 1994-95
Answer: A
The difference between the number of students passed to failed for 1991- 92 = 150-100 = 50
The difference between the number of students passed to failed for 1992- 93 = 200-100 = 100
The difference between the number of students passed to failed for 1993- 94 = 300-50 = 250
The difference between the number of students passed to failed for 1994- 95 = 250-100 = 150
The difference is minimum for 1991-92,So, answer is A option.
How many times number of failed students is same?
A. 1
B. 2
C. 3
D. 4
Answer: D
By visual observation number of failed students is same in 1991-92, 1992-93, 1994-95,and 1995-96. Therefore, answer is four times.
What is an approximate percentage of students failed during 5 years?
A. 65%
B. 27%
C. 51%
D. 80%
Answer: B
For 1991-92 Passed = 150, Failed = 100
For 1992-93 Passed = 200, Failed = 100
For 1993-94 Passed = 300, Failed = 50
For 1994-95 Passed = 250, Failed = 100
for 1995-96 Passed = 300, Failed = 100
Required % = Total number of passed students / Total number of failed students = (100 + 100 + 50 + 100 + 100) / (250 + 300 + 350 + 350 + 400)
= 450 / 1650
= 27.27% ≅ 27%
When is the percentage increase in the total number of students maximum in comparison to the previous year?
A. 1995-96
B. 1994-95
C. 1993-94
D. 1992-93
Answer: D
In the year 1992-93, % increase = 100 x (300 - 250) / 250 = 20%
In the year 1993-94, % increase = 100 x (350 - 300) / 300 = (50 / 3)% = 16.6%
In the year 1994-95, % increase = 100 x (350 - 350) / 350 = 0%
In the year 1995-96, % increase = 100 x (400 - 350) / 350 = 14.2%.
Therefore, 20% is highest. Hence option A.
What is an average number of students failed in the school in last 5 years?
A. 190
B. 180
C. 80
D. 90
Answer: D
Total number of failed students = 100 + 100 + 50 + 100 + 100 = 450
Therefore, the required average = 450/5 = 90
Directions for questions 6 – 10:Study the following graph and answer the questions given below:
The highest and lowest ever voters turn- out (in percentage)is respectively in which years?
A. 1984 and 1962
B. 1971 and 1977
C. 1957 and 1962
D. 1984 and 1971
Answer: A
By visual observation, In 1984, voters turn- out (in percentage)is highest which is 64%
In 1962, voters turn- out (in percentage)is lowest which is 55%.
In which of the options, the numeric difference in voters turnout (in percentage) was nearly equal to 7%?
A. 1957-62
B. 1984-89
C. 1996-98
D. 1971-77
Answer: A
Option (A) The required fluctuation = 62.2 – 55 = 7.2%
Option (B) The required fluctuation = 64 – 62 = 2%
Option (C) The required fluctuation = 61.97 – 57.9 = 4.07%
Option (D) The required fluctuation = 60.5 – 55.3 = 5.2%, Obviously Option (A) satisfies
The average voter turnout (in percentage) between 1952 to 1998 was approximately?
In which year was the growth in the average voter turnout (in percentage) to be the second highest in comparison to the previous elections?
A. 1967
B. 1984
C. 1998
D. 1977
Answer: A
For 1967, growth from 55 to 61.3 is 6.3%.For 1984, growth from 56.9 to 64 is 7.1%.
For 1998, growth from 57.9 to 61.97 is 4.07%. For 1977, growth from 55.3 to 60.5 is 5.2%
Therefore, for 1967 the average voter turn out to be the second highest in comparison to the previous elections.

 (1)_2.jpg?null)